Uncovering Patterns of Institutional Trust and Perception
This project was completed as a final project for CSCI2370: Interdisciplinary Scientific Visualization in Spring 2025 at Brown University. It introduces an interactive web-based system for exploring complex, multi-dimensional public trust data across U.S. government agencies.

Background
Public trust in governmental and institutional agencies plays a central role in civic engagement, policy compliance, and social cohesion. Survey instruments often measure this trust across multiple dimensions—such as competence, integrity, transparency, and fairness—but these rich datasets are typically reduced to static 2D charts that obscure deeper structure.
Traditional bar charts, scatter plots, or isolated radar charts struggle to support meaningful comparison across many entities and attributes simultaneously. As dimensionality increases, so does cognitive load, limiting analysts’ ability to identify similarity, imbalance, or latent structure.
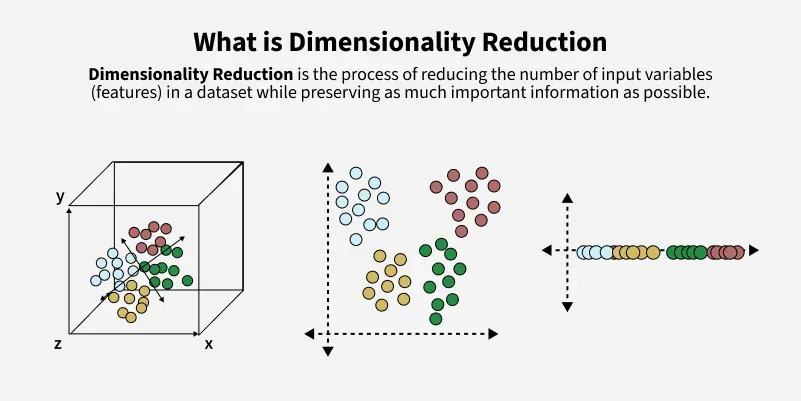
This project addresses that gap by combining machine learning–based dimensionality reduction with interactive, interpretable visual encodings, enabling both global pattern discovery and detailed, multi-attribute comparison.
GitHub Repository:
https://github.com/gmilovac/VizPublicTrust
Final Paper (PDF): https://drive.google.com/file/d/1wSXAEOol4nxUMIZlXJIBNmMfyp-q3sjB/view?usp=sharing
Project Goal
The primary goal of this project was to design and evaluate an interactive visualization system that allows users to:
- Identify similarity patterns among institutions
- Compare trust profiles across multiple dimensions
- Perform these tasks faster and more accurately than with conventional 2D visualizations
A secondary goal was to empirically validate the system through a controlled user study, measuring performance, confidence, and perceived workload.
Methodology
Data
The dataset consists of survey-based public perception scores for approximately 30 U.S. government agencies, measured across:
- Five trust dimensions (e.g., competence, integrity, dependability)
- Two style dimensions: Warmth and Dominance
All dimensions were normalized to ensure equal contribution to similarity calculations and visual encodings.
Dual-Visualization System
The system integrates two complementary views:
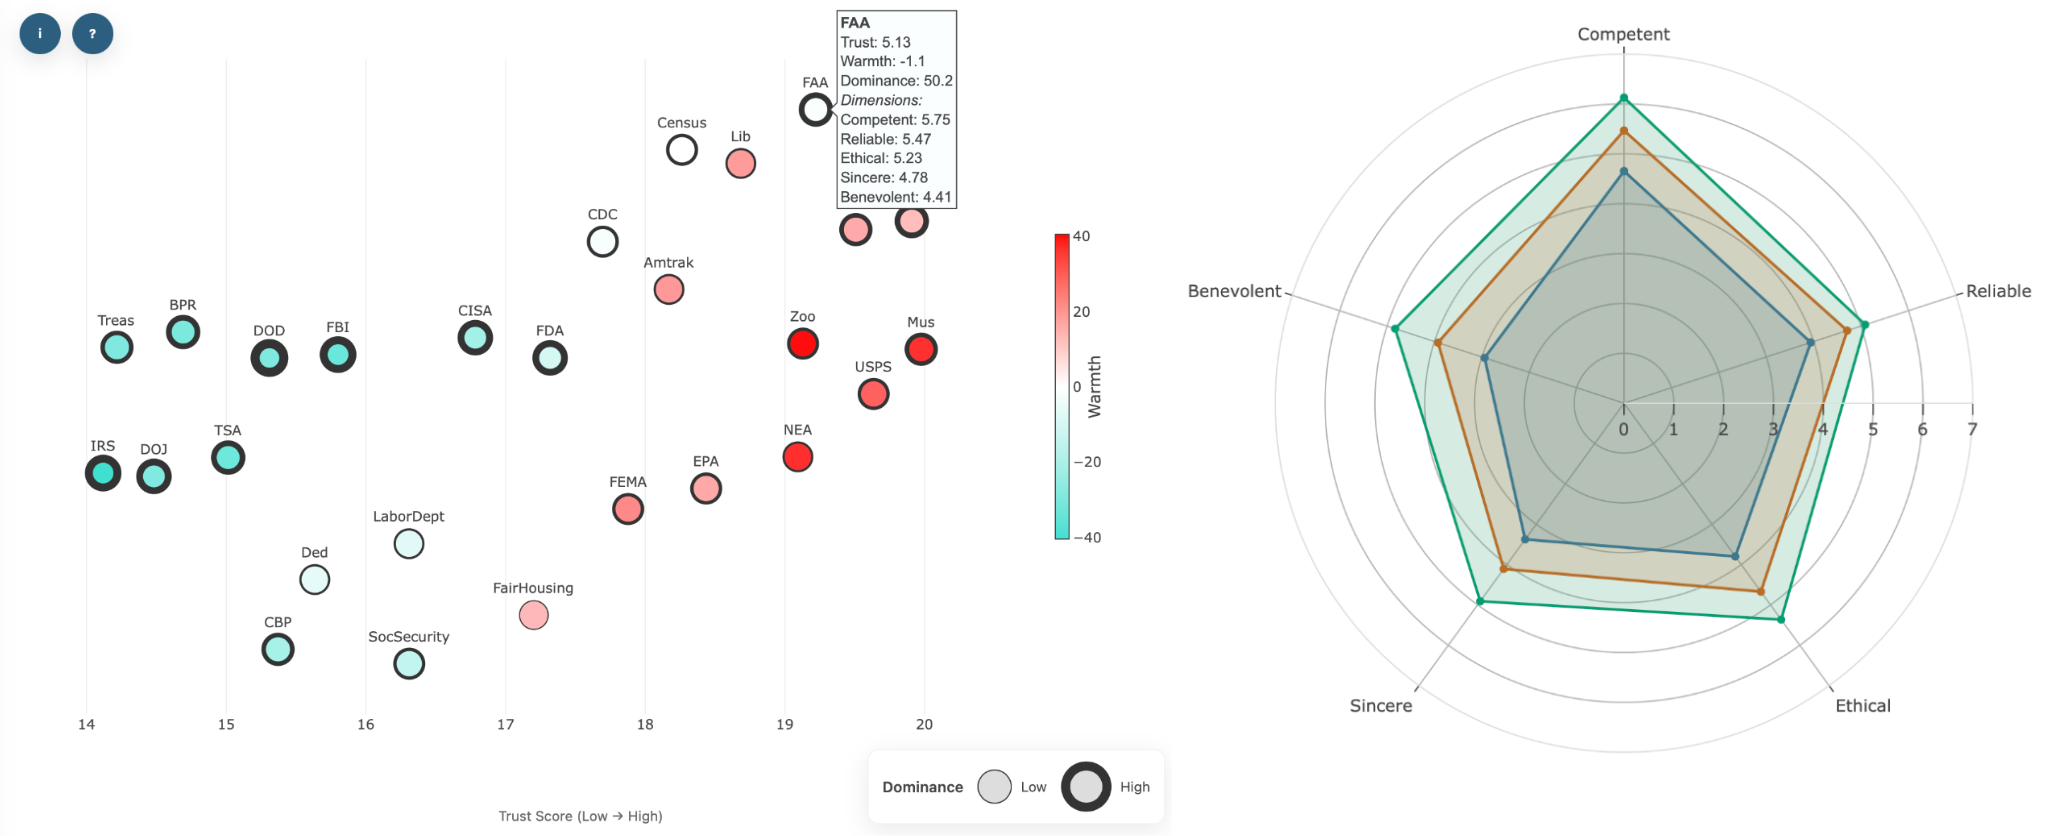
1. UMAP Similarity Map Uniform Manifold Approximation and Projection (UMAP) was used to embed the five trust dimensions into a two-dimensional space. Each point represents an agency, with spatial proximity encoding similarity across the full trust profile. This view provides an overview-first mechanism for global pattern discovery.
2. Overlying Radial Graphs To support detailed comparison, we designed an interactive radial graph system that allows multiple agencies to be overlaid within a single plot. Each axis represents one dimension (five trust + Warmth/Dominance), with color and transparency enabling direct, simultaneous comparison.
Users can dynamically search for and select agencies, immediately revealing where profiles align or diverge across dimensions.
User Study
We conducted a controlled online user study with 25 participants, comparing:
- Visualization A (Baseline): Traditional 2D plots and separate radial charts
- Visualization B (Proposed): UMAP similarity map + overlying radial graphs
Participants completed similarity, comparison, and pattern-recognition tasks under both conditions. We measured:
- Task completion time
- Accuracy
- Confidence
- Perceived workload using NASA-TLX
Results and Analysis
Performance:
-
Task completion time decreased by ~18–20% on average
- Baseline: ~9.1 minutes
- Proposed system: ~7.4 minutes
Accuracy:
- Baseline accuracy varied widely (≈55–75% on some tasks)
- Proposed system consistently achieved 95–100% accuracy on most tasks
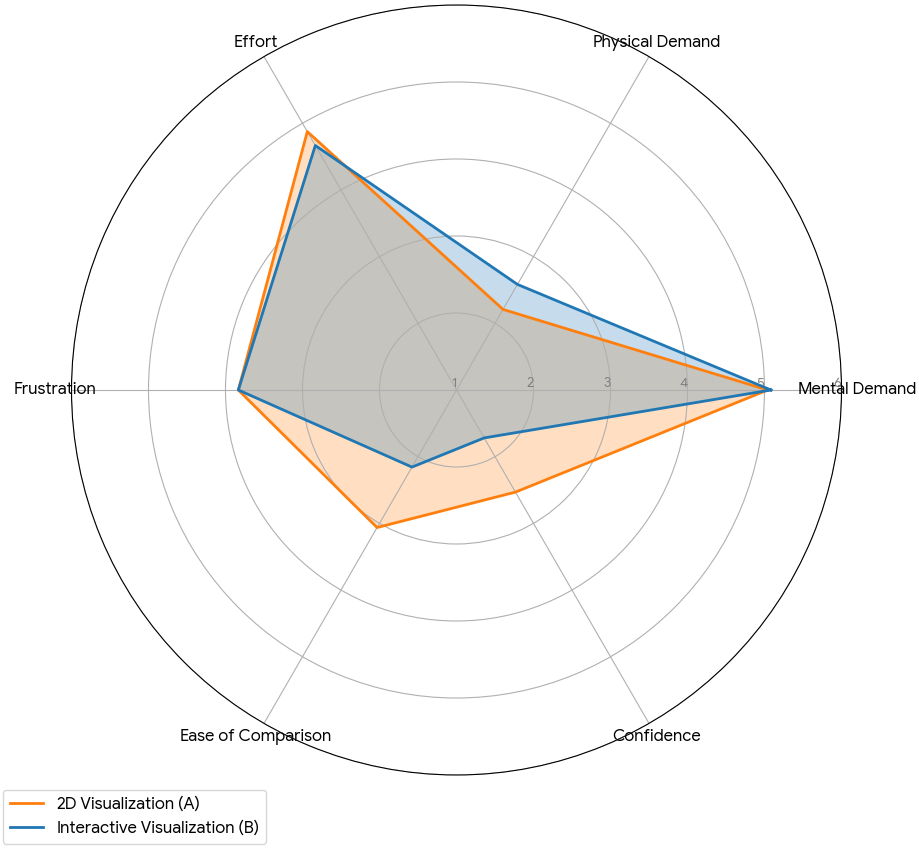
Perceived Workload:
- Lower reported effort and higher ease of comparison
- Significantly higher user confidence
- Comparable frustration levels, with improved usability overall
Participants overwhelmingly preferred the proposed system, citing clearer comparisons and better support for understanding multi-dimensional structure.
What Worked and What Didn’t
Successes:
- Effective combination of global (UMAP) and local (radial) views
- Overlying radial graphs reduced cognitive overhead for comparisons
- Search-and-select interface improved usability
- Empirical validation demonstrated clear performance gains
Limitations:
- UMAP interpretability still requires explanation for novice users
- Visual overlap can become dense when too many agencies are selected
- Dataset size limited to ~30 agencies
Conclusion
This project demonstrates that integrating dimensionality reduction with interactive, multi-attribute visual encodings significantly improves users’ ability to interpret complex trust data. Compared to traditional 2D approaches, the proposed system enabled faster, more accurate, and more confident analysis.
More broadly, this work highlights how thoughtful visualization design—grounded in both machine learning and HCI principles—can meaningfully enhance analytical reasoning in high-dimensional domains.
Future Work
- Scale the system to larger datasets and international institutions
- Explore alternative embeddings and stability across UMAP parameters
- Add temporal views to study trust dynamics over time
- Incorporate uncertainty visualization for survey variance
Author & Contributions
Shravya Munugala: Project conception, evaluation design, data preprocessing, baseline system development, quantitative analysis, and report writing.
Gordan Milovac: Dual-visualization system design, overlying radial graph innovation, UMAP implementation, usability refinement, deployment, pilot study execution, and analysis.
© Gordan Milovac.Resume PDF